Cancer Detection Using Convolutional Neural Networks
By Zachary Somma
Cancer is a massive global health problem. It is the second leading cause of death worldwide each year[1] and is one of the largest medical expenses for both individuals diagnosed and researchers looking for a cure[2]. Diagnosis is the first and arguably most important step in treating this issue. That’s because early diagnosis of cancer drastically improves mortality rates and lowers the cost of treatment[3].
Medical imaging techniques[4] are some of the most common ways of diagnosing cancer. Images that are produced by a machine (specific to the test) are analyzed by physicians and other experts to determine if there is a tumor present, and if so then what type it is[5]. Some limitations to this method are human error in analysis, time costs of having people look at the images, and the fact that there isn’t always someone immediately available to make the diagnosis, especially given the shortage of physicians across the U.S. and worldwide. Neural networks, specifically Convolutional Neural Networks (CNNs) offer a potential solution for each of these limitations by automating the diagnostic analysis.
Convolutional Neural Networks
Convolutional Neural Networks are a special type of artificial neural network that are particularly good at categorizing images or grid-like datasets. Their architecture is sparse, topographic, feed-forward, multilayer, supervised, and both linear and non-linear on different layers[6].
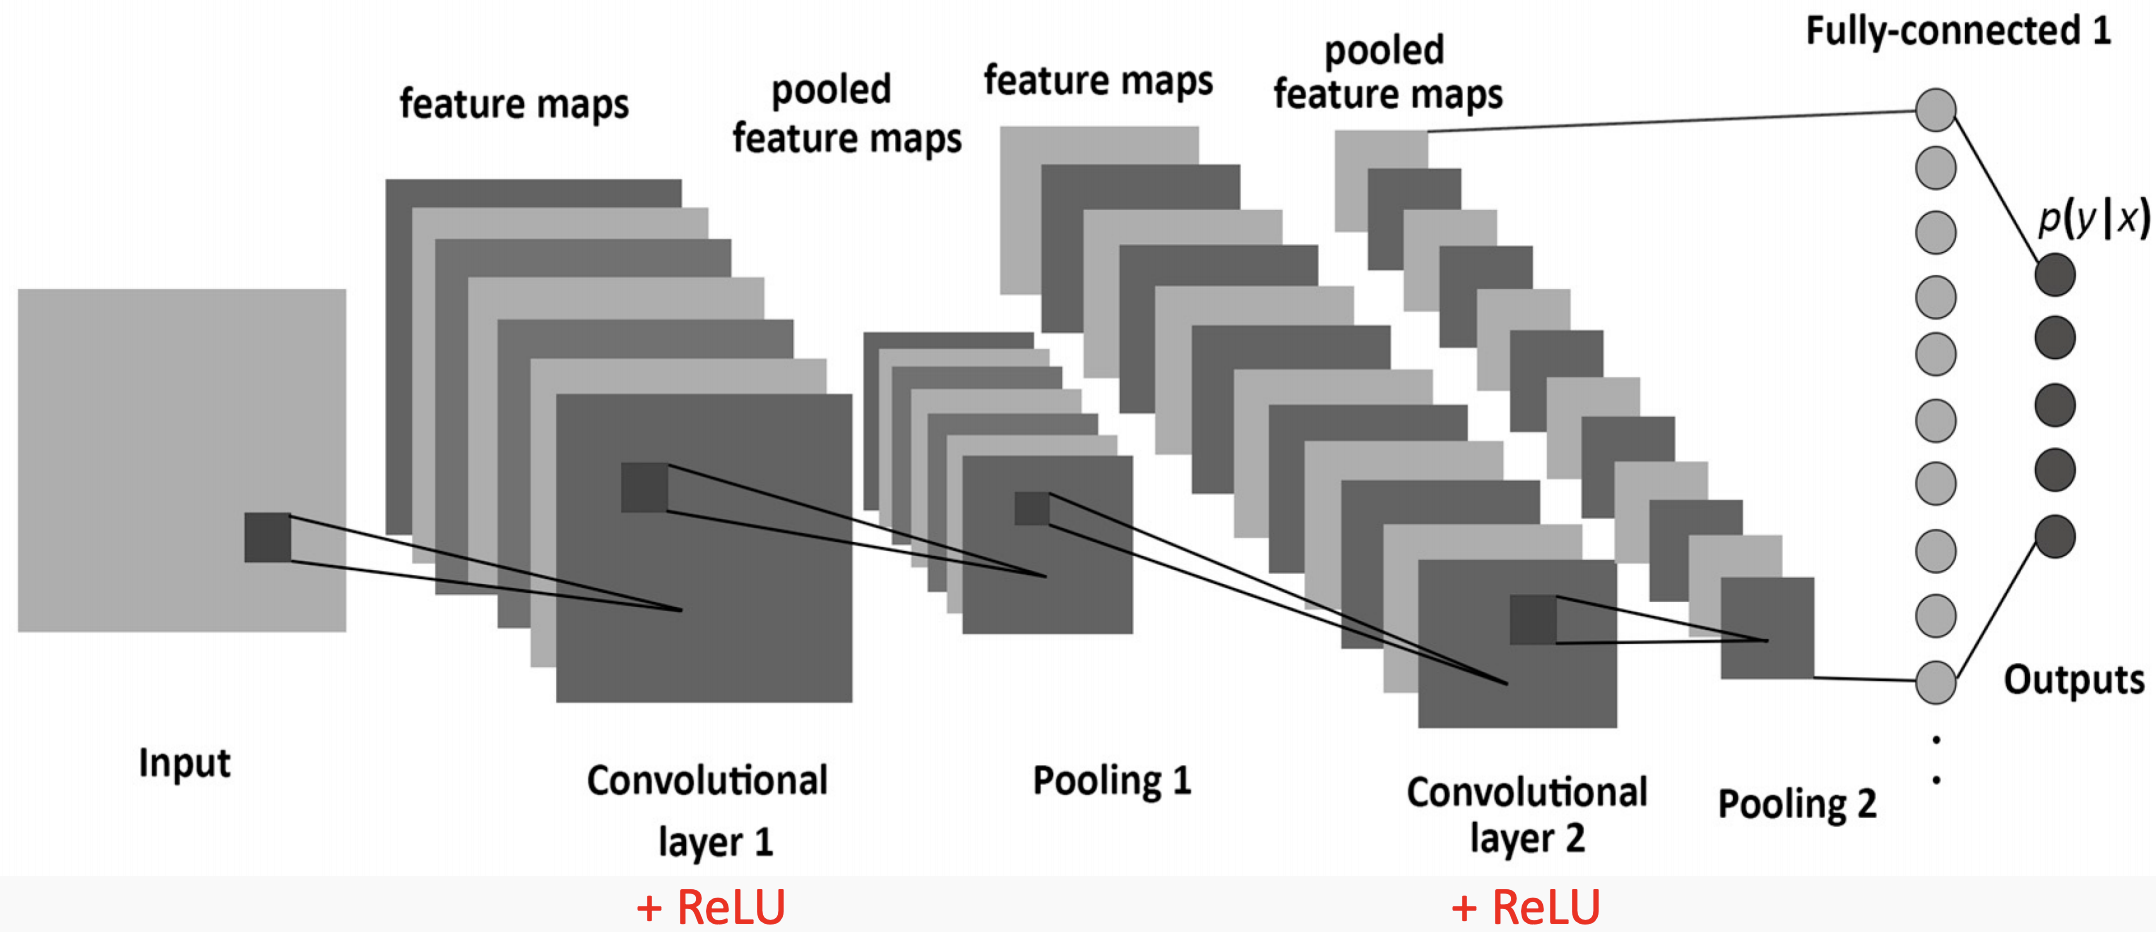
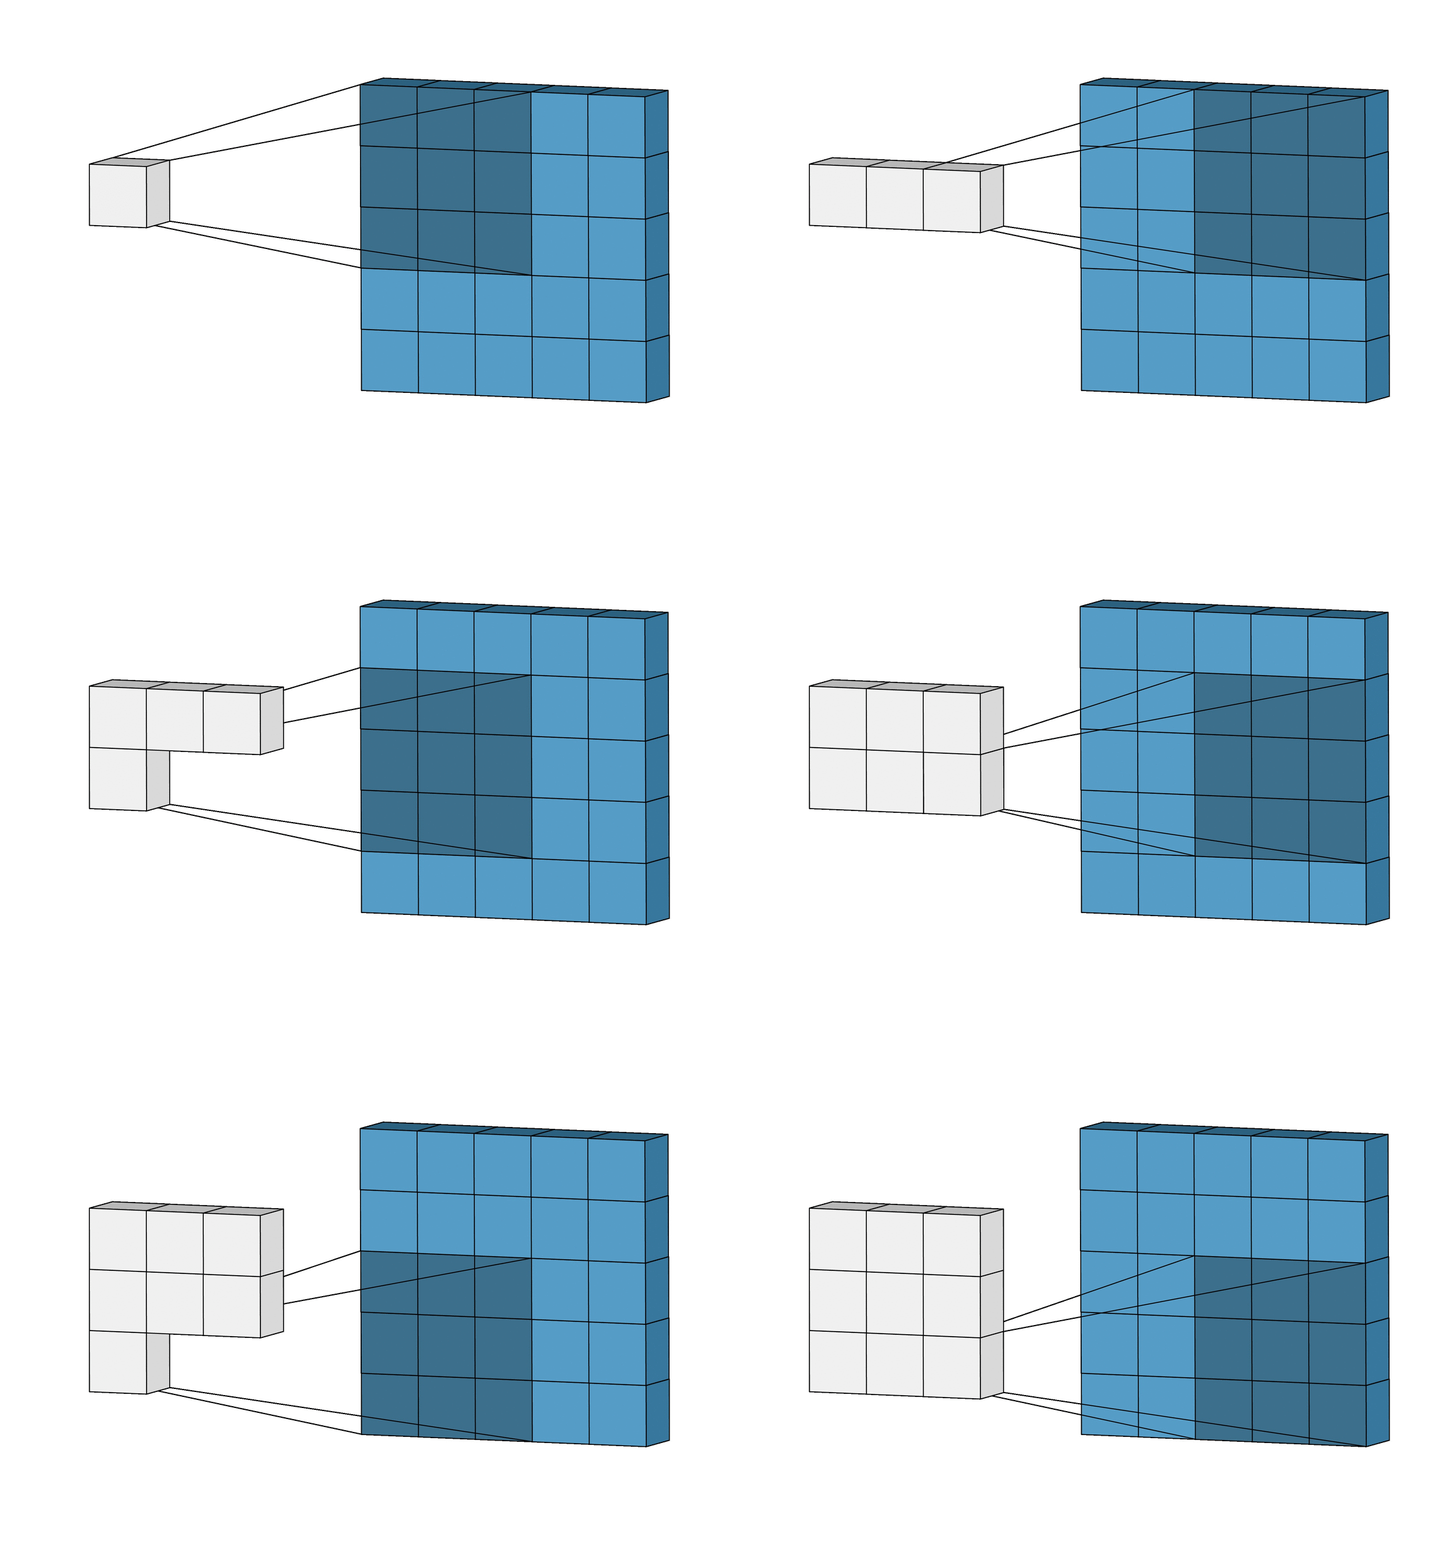
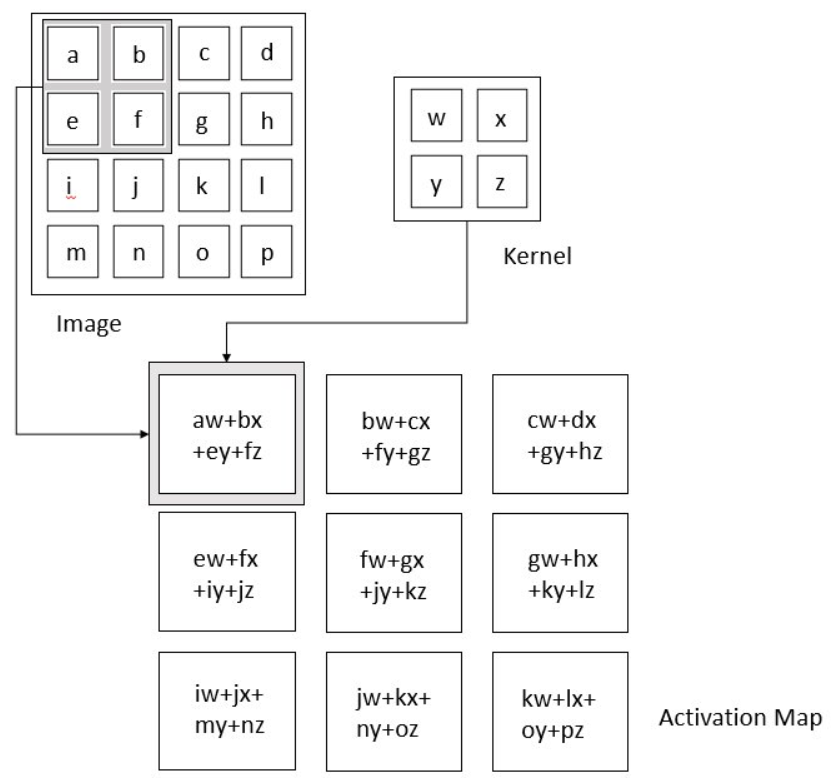
Images in this network first pass through the input layer, where each pixel of an image is given a value based on the darkness of it. These values then are passed onto the first hidden layer, called the convolutional layer. This layer has a filter that uses a matrix of pre-determined dimensions and trained weight values. The dot products are calculated between the filter and all segments of the image with the same dimensionality as the filter. The values on the filter can be trained to identify specific characteristics about a particular image. Then as the filter scans over each segment of the image, the dot product essentially tells us whether or not that section of the image contained the desired feature. This layer of calculations can be repeated for however many characteristics are being filtered for[7].
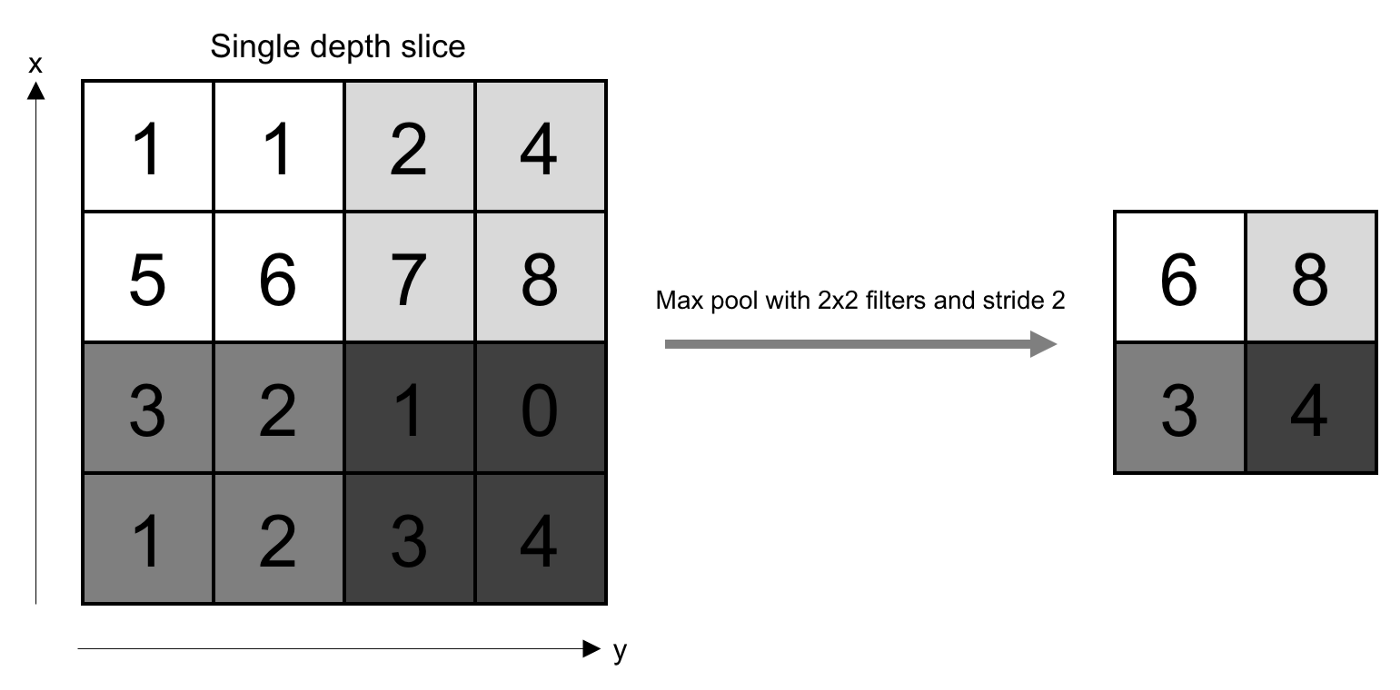
All of the dot product values are then output onto a feature map (sometimes called an activation map), which holds these dot products in the same topography as the original image. The feature map is sent to the next layer, called the pooling layer. Another filter of some specific size is used here, but instead of a dot product calculation, it simply carries over the largest value of each section looked at. The main function of this layer is to reduce the dimensionality of the feature map so that the most important data points are the ones being subject to the later classification[8].
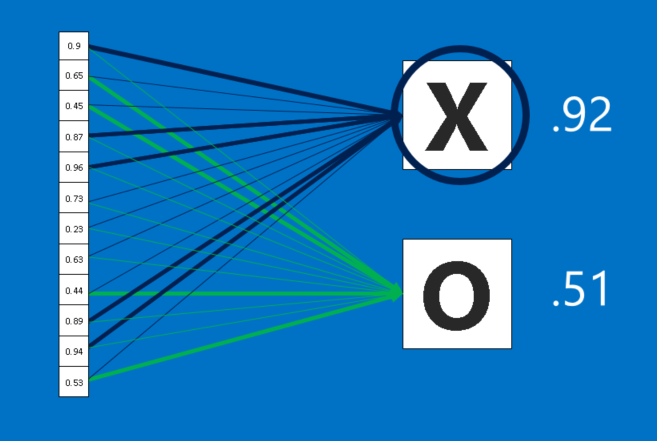
The pooled data is then sent to the third and final hidden layer, which is the fully connected layer. This layer is identical to a perceptron in that it has a matrix of weight values that are combined with the pooled data points in a dense architecture, which identifies how each data point contributes to a certain category. It is as if each of the data points is casting a vote as to which category it believes the image should be a part of. These values are then sent to the output layer, which assigns a category to the input image[9].
Gallery
Figure 1. The layers of a standard CNN
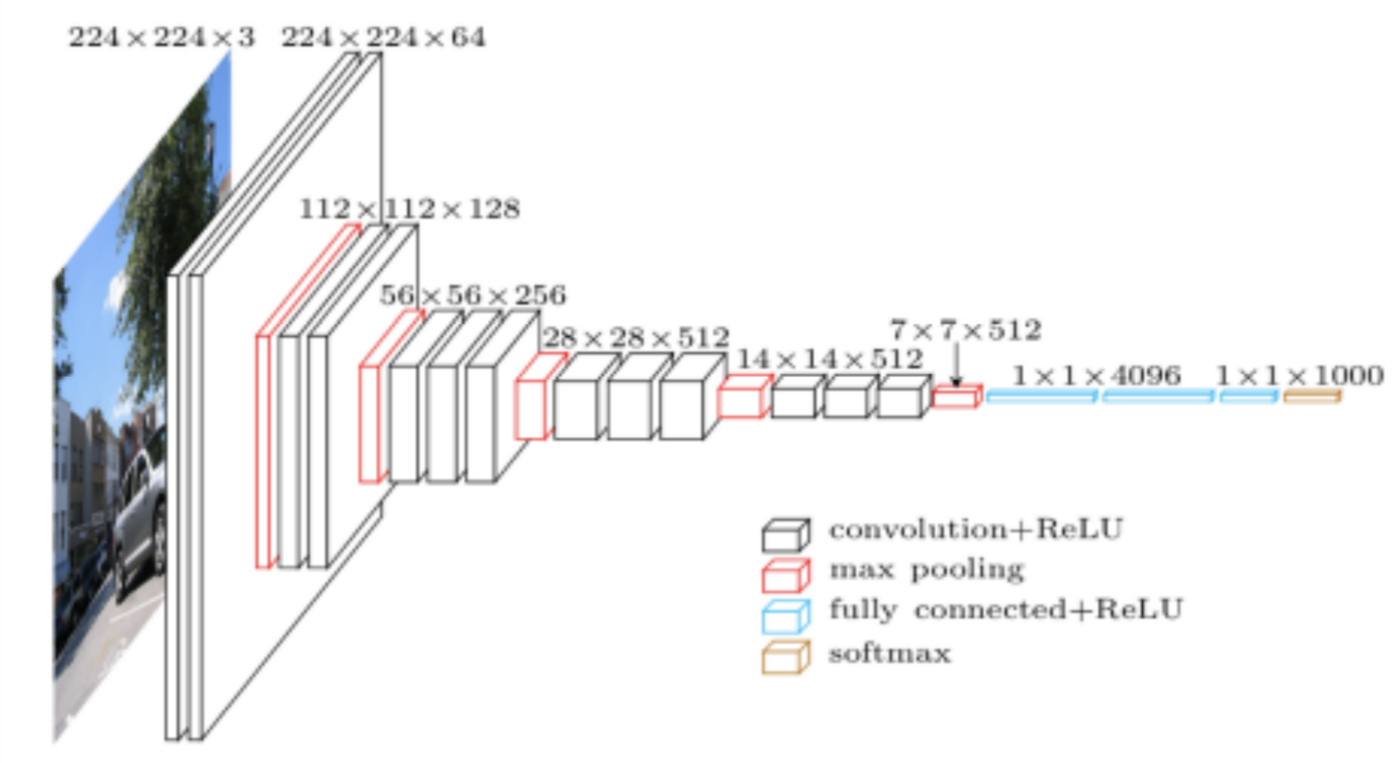
Figure 2. Complete architecture of a standard CNN, showing length, width, and depth dimensionality
Figure 3. An animation of the convolutional calculations
Figure 4. Convolution calculations using dot product. The kernel is another term for the filter.
Figure 5. The pooling layer selects the highest value from each section
Figure 6. The fully connected layer performing classifications for each pooled value
References
Roser, M., & Ritchie, H. (2015). Cancer. Our World in Data. [10]
Levey, N. (2022, July 9). She was already battling cancer. Then she had to fight the bill collectors. NPR. [11]
Early cancer diagnosis saves lives, cuts treatment costs. (2017, February 3). World Health Organization. [12]
How Cancer Is Diagnosed. (2019, July 17). National Cancer Institute. [13]
Mishra, M. (2020, September 2). Convolutional Neural Networks, Explained. Medium. [14]
Stewart, M. (2020, July 29). Simple Introduction to Convolutional Neural Networks. Medium. [15]
Rohrer, B. (2016, August 18). How do Convolutional Neural Networks work? [16]
